How to Measure Sprint Velocity in Agile

A jet’s cockpit is packed with instruments and gauges that give pilots the information they need to fly an aircraft safely and effectively. The artificial horizon, airspeed indicator, altimeter, turn coordinator, heading indicator, and vertical speed indicator all provide critical data. And those are just the core flight instruments.
But while some metrics – like altitude – are more important than others, a pilot never relies on one metric alone to fly a plane.
Scrum teams also have many instruments and metrics available to guide their work. Many fixate on just one: Sprint velocity. But focusing on one metric without paying attention to other indicators can lead teams into a nosedive or burnout. Just like pilots who forget to check their fuel levels.
This article explores how sprint velocity can benefit your Agile team. But also why people sometimes misunderstand this agile metric.
👻 Psst! If you’re new to Agile or need a refresher on specific terms, pull up this handy Agile glossary in another tab, and refer to it as needed.
What is Sprint velocity in Agile?
Velocity – or Sprint velocity – is the number of story points completed by a development team in one Sprint. Story points measure the complexity of tasks or user stories – user-centric product narratives – and how much effort it takes to accomplish them. Some teams use different measurements, like hours or stories completed, to calculate their velocity. Whatever data you use, the concept remains the same: Velocity indicates how much work the team has finished in a Sprint.
It’s important to note that velocity is measured at the team level and never at the individual level. This is because optimizing team performance outweighs the benefits of optimizing individual performance. While this is not explicitly stated in the Scrum Guide or Agile Manifesto, it is an implied tenet of both.
Velocity will vary in the beginning of a Sprint, and you won’t be able to optimize it until it’s stable. Maarten Dalmijn, agile consultant and Serious Scrum ambassador, recommends you make everyone aware of the initial variability of velocity in advance. Managing expectations prevents stakeholders from losing their belief in Scrum. It also protects the team’s motivation.
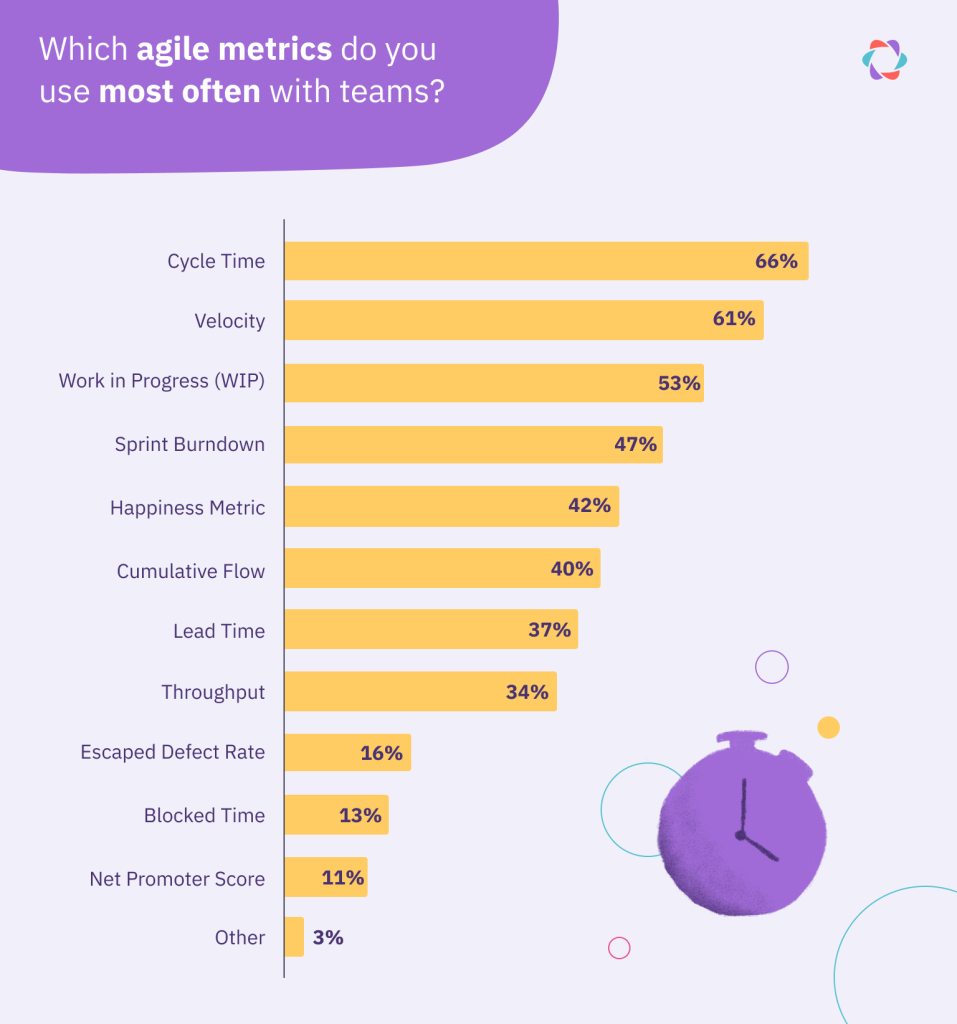
The paradox of velocity was neatly illustrated in a survey we ran on Agile metrics. Survey respondents ranked it as the second most popular metric, but it was also the metric most commonly mentioned as unhelpful. 😯
How to calculate sprint velocity
To calculate Sprint velocity, Scrum teams need to account for what is accomplished during each Sprint. This is done by compiling user stories and adding up the number of story points completed in a sprint.
1. Compile user stories
User stories have taken the place of arbitrary or faceless product narratives. Instead of making a claim like, “The functionality shall save time by allowing products to be uploaded in bulk to the ecommerce storefront,” a user story example may say:
“As a user, I want to be able to bulk upload products to my ecommerce store so that I save time.”
User stories illustrate the value users desire from products rather than dictating how this value will be created.
User stories:
- Shift attention from technical details to user needs
- Prioritize a product or feature’s value for customers or end-users
- Help developers and teams prioritize tasks based on user needs
Once they have a user story, Scrum teams break it down into tasks. They assign each task a number of story points, which estimate how much effort it will take to complete. When considering story points, teams should take several factors into account:
- The effort it will take to complete and quality test the task
- The task’s complexity
- The task’s associated risk due to unknown or risky factors (like a team member leaving the organization)
- The team’s previous experience with similar tasks
- The level of team collaboration and cooperation the task requires
Once all factors are considered, Scrum teams determine the value each user story is worth rather than simply estimating the number of hours it will take to complete a task.
2. Add up story points
Once your Sprint is complete, you can calculate your velocity by totaling the story points for each completed user story. For example:
Say you estimated story A at four points, story B at two points, and story C at three points, and you completed all three. Your velocity is 9. But if you only finished half of story A, you can’t include any of its points, and your velocity for that Sprint is 5. Scrum requires stories to fit in one Sprint. Excluding unfinished stories from velocity encourages teams to make tasks smaller in the future.
3 reasons to measure Sprint velocity
Velocity can help teams make more accurate plans for future Sprints. This helps teams understand how many story points they can generally complete in one Sprint. The number can also serve as a conversation starter when you set the stage in your retrospective meetings or be a warning signal for teams to investigate.
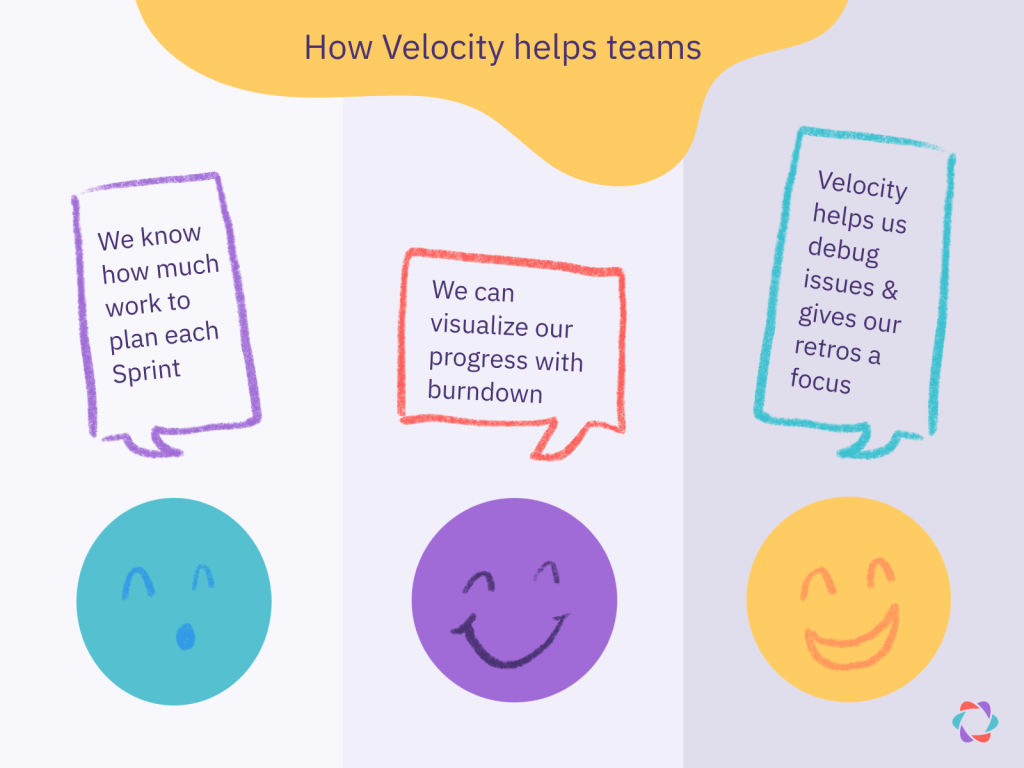
1. Velocity helps plan your Sprints
During Sprint Planning, you can use your historic velocity to calculate how much work you can reasonably take on for one Sprint. Many teams find value in calculating their average velocity over the past three Sprints. This can then serve as a cap for the number of story points bookmarked for the upcoming Sprint.
Say your average velocity over the past three Sprints was nine story points. In that case, the story point sum of the items you’re selecting for the upcoming Sprint shouldn’t exceed that number.
Velocity sets the expectation in Sprint Planning for how much work your team can complete. But it’s not a fixed limit. If teams end up exceeding velocity, that’s fine. For example, it’s likely to happen as new teams have more and more experience working with the codebase or alongside one another.
2. Velocity provides insights about potential setbacks
When you’re tracking Sprint velocity regularly, your averages will become more consistent. So, if you see a sudden drop, your alarms will go off about a potential roadblock or issue.
If your velocity fluctuates heavily between Sprints, it could signal your user stories are too large. In that case, you may need to do more story splitting to cut them up into smaller pieces of work. But it could also signal burnout, blockers, or other process issues that need debugging in your retros.
Whatever the case, if you notice an outlier in your velocity, it’s likely an indication of a larger issue that should be addressed immediately. Addressing it may mean big changes like reconsidering Sprint goals altogether or smaller changes like reassigning tasks.
3. Velocity gives sprint retrospectives a clearer focus
You can use velocity during Sprint retrospectives to measure the effectiveness of changes you’ve made to your work process. It’s a great way to set the stage at the beginning of a retrospective:
For example, a retrospective facilitator may say:
“This Sprint, we completed 21 story points. Our average velocity has been 25 story points based on the past three Sprints. That means our velocity dipped slightly this Sprint compared to last.”
In Scrum, user stories should fit within one Sprint and ideally be capable of completion in one day at most. When they don’t, you may find that teams make progress on a story but can’t add its points to the current Sprint’s velocity since they didn’t finish the item, causing fluctuations in the metric.
How to visualize Sprint velocity with charts
To better understand how their team is performing, it’s helpful for Agile coaches and Scrum Masters to be able to check Sprint velocity at a glance. Visualizing Sprint velocity data in charts makes checking in on progress simple.
Velocity chart
A velocity chart is typically a bar graph that compares a team’s projected work during a Sprint with the actual completed work. In a velocity chart, the X-axis (horizontal axis) represents individual Sprints, and the Y-axis (vertical axis) shows the number of user stories or story points.
This type of graph is great for simply conveying estimated vs. actual work within Sprints. It helps project managers and other leadership team members quickly estimate their team’s performance.
Burndown chart
A Burndown chart compares the estimated amount of work your team still needs to complete with the time remaining in a Sprint. The goal is for the line in the graph to move increasingly closer to zero – or “burn down” – as the Sprint progresses toward the last day.
Measuring Sprint velocity in a Burndown chart lets you visualize your progress. Burndown charts help teams get a clearer picture of what delivery looks like across the Sprint. They can answer questions like: Are story points gradually completed over the Sprint? Is there often a rush toward the end?

By comparing actuals versus your “ideal burndown” line, you can see if you’re on track or falling behind.
How to improve Sprint velocity
Now that you know how to measure and visualize velocity, you can begin to think about improving it through optimization. Your overall goal is to optimize – but not necessarily accelerate – velocity. You want to make sure you set the right objective for your optimization efforts. Aiming for increased velocity makes sense if you’re focused on productivity gains. But a lower number might be better when you want to improve the quality of work, like reducing bugs.
It’s recommended that you start relying on and expecting a relatively stable Sprint velocity after three to five Sprints.
You need a baseline to measure from, so if you try to optimize velocity too soon in the process, it will be ineffective (and irrelevant). You simply won’t have enough data for optimization to be meaningful.
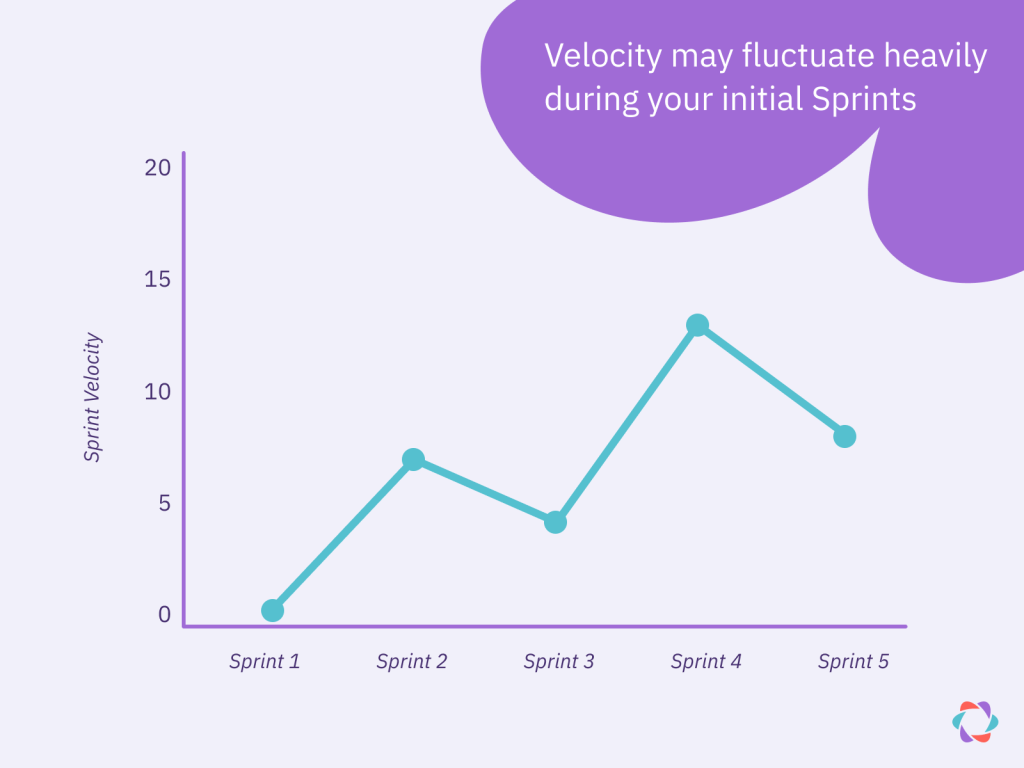
During a team’s initial Sprints, for example, velocity will almost certainly fluctuate heavily. You’re still calibrating estimates, meetings take longer, and developers may be unfamiliar with the codebase, so there’s less time for execution as people figure out how to collaborate effectively.
With that said, you can improve sprint velocity by:
🎓 Mastering backlog refinement
Refined backlogs contain plenty of detail. When it’s time to start a new task, team members have all the information they need to complete it. Backlog refinement often involves assigning story point estimates, which set a guide for how much effort a task involves. Backlog refinement helps teams maintain a high Sprint velocity and focus on execution because all the thinking and planning have been done in advance. If you’re not refining your backlog, you won’t have an accurate understanding of how adding new tasks will impact your velocity.
🤖 Automating parts of your work process
Learn how to automate tests, generate code automatically, or use templates for specific product parts. This may take an upfront investment of effort to set up, but it pays dividends in improved velocity.
👨🏻💻 Being aware of changes or shortcomings on the team
While you measure velocity at the team level, the performance of individual members naturally influences the number. Perhaps requirements have changed, and you’re missing a critical skill on the team, or a former top performer is going through a rough period personally, which is reflected in the team’s velocity. Keep this possibility in mind when you’re looking for ways to optimize your velocity further.
🔍 Looking at outside dependencies and technical issues
When you don’t find room for improvements within the team, look at external factors that affect your velocity. Perhaps the customer doesn’t provide feedback quickly, or another department, like finance, has a complicated approval process for purchases the team needs. Also, review potential technical obstacles, like an old testing server that gives the team headaches and lowers velocity.
🚀 Dedicating a Retrospective to optimizing velocity
Hold a retrospective with the team when you want to find additional optimization opportunities. Maarten has a list of helpful questions you can ask during such a session, like “Was there a lot of rework on issues?” or “Did the team actually make a plan on how to deliver the Sprint Goal?”
(Graphic adapted from Maarten Dalmijn)
During a team’s initial Sprints, for example, velocity will almost certainly fluctuate heavily. You’re still calibrating estimates, meetings take longer, and developers may be unfamiliar with the codebase, so there’s less time for execution as people figure out how to collaborate effectively.
Sprint velocity FAQs
Velocity can help or hurt your team, depending on how – and by whom – it’s deployed. Below, we answer four frequently asked questions about Sprint velocity to clarify common misunderstandings and abuses.
Should I compare team performance and productivity with velocity?
No, velocity is an unreliable metric for tracking team productivity. Using the number in that way also conflicts with the fundamental Agile principles of delivering customer value and trusting teams to self-organize and get the job done.
Velocity makes for a lousy performance metric and turns into “measurement theater” for several reasons:
- ⚖️ Story points are relative units of measurement. Story points are a “local currency” unique to your team. One story point represents a different value for team A than it does for team B. Making comparisons between teams doesn’t work.
- 👑 The team rules the number. Even when outsiders take control of velocity, the team holds ultimate power over the number. They can, for example, inflate their estimates during Sprint Planning, cut corners in their work, or only take on simple tasks they can quickly complete to satisfy “velocity goals.”
Agile’s basic premise is that delivering customer value early and often matters most and that a self-organizing team knows best how to do that. As long as the team hits their Sprint goals and produces customer value continuously, how they do so is their business and should certainly not depend on their velocity, a number that says little about value delivered, especially when viewed in isolation from other Agile metrics.
Should Sprint velocity always keep going up?
Whether Sprint velocity should always increase depends on who you ask.
Scrum co-creator Jeff Sutherland is pretty clear on this point. His website states that:
“A well-functioning Scrum Team’s velocity should steadily trend upward by roughly 10% each Sprint.”
But many Agile practitioners, like Maarten Dalmijn, the experts we surveyed, and John Cutler, who coined the term “feature factory,” don’t share this view. They argue that an obsession with velocity can lead to lower quality work, product features with little customer value, or team members burning out.
Common sense alone shows that higher velocity isn’t always the appropriate goal and that it cannot keep increasing into infinity.
Reducing velocity naturally serves any situation where slowing down might increase quality, value delivered, or team happiness.
So, should Sprint velocity keep going up? We’d say often – especially when you start working together as a new team – but certainly not always, and only for the right reasons.
What’s the difference between a team’s velocity and capacity?
A team’s velocity and capacity are both Agile metrics, but they often get confused. Both are used to measure and predict how much work a team can complete, but they do so differently.
- 🏎️ Velocity looks at past performance to predict the right amount of work for the next Sprint. E.g., Comparing story points completed over time.
- 🏟️ Capacity focuses on resources. It takes the velocity number and adjusts it to estimate a team’s available development resources in upcoming Sprints.
For example, you have a team of just two developers whose average velocity is 10 story points. One of them will be on vacation for the entire next Sprint. In that case, you have 50% fewer developers, so your capacity for the next Sprint would be 5 story points.
Should I use velocity to manage stakeholders’ expectations?
Sometimes, Product Owners (POs) use velocity to make forecasts to stakeholders about Sprint, feature, or project completion. Say the total number of estimated story points for your project adds up to 100, and your average Sprint velocity is 10. Then, you could forecast that it will take you 10 Sprints to deliver the project.
There are two issues with using velocity in this way:
- 😬 It’s highly uncertain, and you’ll need to add a large buffer to your estimate. A lot of things can change during 10 Sprints that will affect velocity. Team members might leave, new items might enter the product backlog, estimations might turn out incorrect, and so on.
- 🎯 It turns the number into an external goal instead of a tool for the team. Rarely will outside stakeholders accept something as an estimate that’s subject to change. Once given, the estimate often morphs into a hard deadline. That change turns velocity from a team-owned metric into a fixed, externally set due date that can add considerable pressure to the team or result in some form of punitive action if not met.
Sprint forecasting, in this example, only serves external stakeholders, whereas using Sprint velocity as a cap or the limit of what can be achieved helps the team plan their Sprints more accurately.
So, how can you work around this and still manage stakeholder expectations?
- Communicate that velocity is an estimate that changes every Sprint.
- Keep stakeholders informed as velocity changes.
- Stop using it if stakeholders can’t understand.
When to say no to Sprint velocity
Sprint velocity is an optional measurement to help Agile or Scrum teams reach their Sprint Goals. The team should own it, track it, and decide whether or not it’s helpful for their work.
When it comes to velocity, you and your team are the ones flying the plane. Nobody else is in the cockpit except your copilot (Scrum Master). And your attention is on the Sprint Goal. So, you cross-check the velocity meter when necessary.
In this metaphor, outside stakeholders are like the executives at airline HQ. They keep an eye on fuel costs and passenger numbers. They’d never radio into your cockpit to inquire – or lecture you – about your flight instruments. So if your managers do, it might be time to press eject on them, Sprint velocity, or both.

Tim Metz
Tim Metz crafts content at Animalz for the world’s most amazing startups. He’s passionate about deep work and work-life balance.